HI All.
For some time now I have been wondering why the customer useage data in Splynx seems to be on the reading low compared to other systems we run such as Aircontrol and CNMaestro. Recently we added LibreNMS (as it has very good resolution for data usage going back more than 24 hours), this also doesn’t correlate, although I am not surprised as it gets its data from the customer radios via SNMP)
We run a routed network, and the Splynx simple queues for all customers are on the edge router in our office.( a CCR1036)
Any ideas why this may be, and suggestions to help test and resolve this issue most welcome.
Thanks, Andy
Hm, this looks strange. Maybe on radio is traffic via other IPs that are not configured in Splynx ?
Splynx stats is based on IP address/pppoe Session. Here LibreNMS takes the whole traffic that is on the customer Radio Uplink interface.
In your case API stats are used. The data that you see on charts we took from Mikrotik IP Accounting (Splynx doesn’t manipulate them at all, just saves).
So, the only one reason is that you don’t have some IPs included in Customer in Splynx and these IPs are generating traffic.
One not related question - Why Splynx stats are empty 22.04 ??? The server was down or what’s the reason for it. Or you deleted IP accounting ?
Hi Alex, No, there are no other IP’s passing traffic not in Splynx on that radio. It seems to be the same for all our clients, this was just an example of one.
I understand that Splynx gets the stats from API from the Mikrotik.
It would be good to design a test in the office to correlate this, as it is a problem we need to solve. Any ideas welcome.
Regarding the missing stats - Splynx was cut off for 1 day as the payment didn’t reach you in time!!
Andy, do you have one or two Splynx servers running simultaneously ?
Laxt time I saw exactly same problem when customer had two servers. Both were connecting via API to Mikrotik. But when one connected, it did a reset of IP Accounting, so when second connected he got just some part of statistics…
HI Alex, no we just have one server running one instance of Splynx
We have seen this as well.
When we took a look at the actual traffic for the customer in question we found the traffic to mainly be arp and internetwork related.
Traffic that does NOT require the router of which traffic is being calculated will never show.
Are you performing the traffic chects at the edge or in the core @ the tower level?
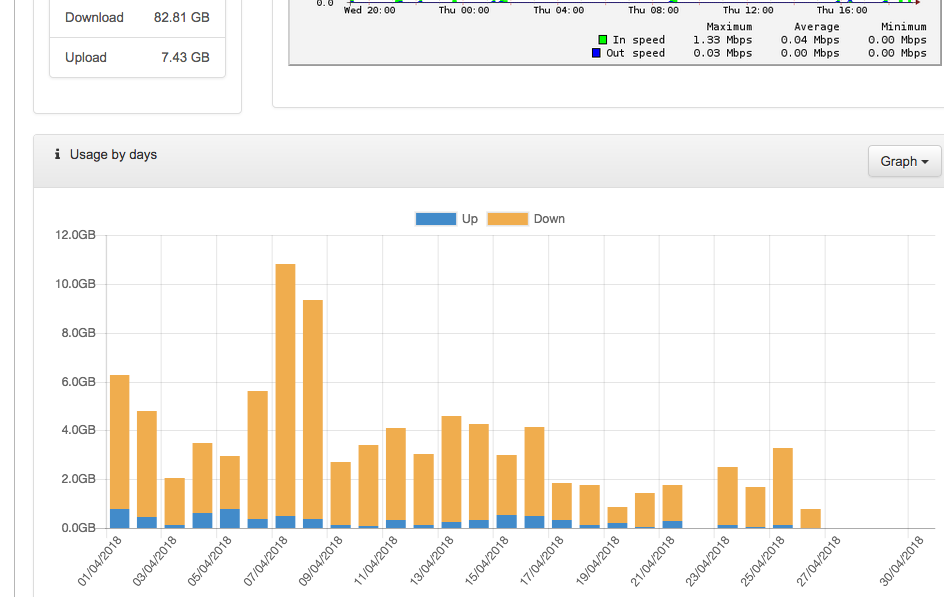
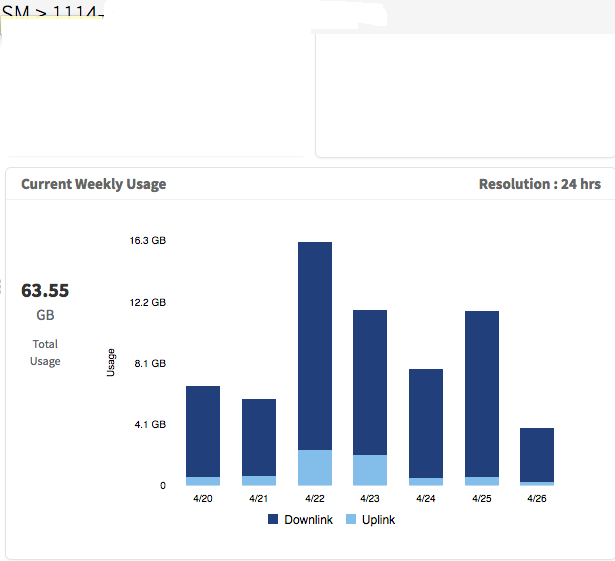
I thought of this answer myself, however, the discrepancy to me looks is too large. In the graphs above, take for example the data for the 23/3/18
The CN Maestro (SM or CPE) - blue graph shows a total of just under 12GB, of which about 2GB is upload. The Splynx graph shows just under 3Gb total, so if the difference was due to ARP and net usage etc, the system would be extremely inefficient.
The Splynx checks are done at the Edge Router.
We need to set up some sort of test to validate this. I could have an SM connect to the AP at our NOC which connects directly to the edge router and set up a constant download with iPerf between a Mikrotik router connected to the CPE/SM for a certain period of time and correlate the data.
Afterwards, I could also set up a second test at my home which is several hops away from the edge and is NATted so is representative of a typical customer to see if the results correlate. Or is there an easier way?
- anyone have any thoughts on this?
Looking at the graphs in my first post you can see a correlation between the graphs - I used a ruler and measured each graph and the correlation CN Maestro graph is approx 2.5 the Splynx graph.
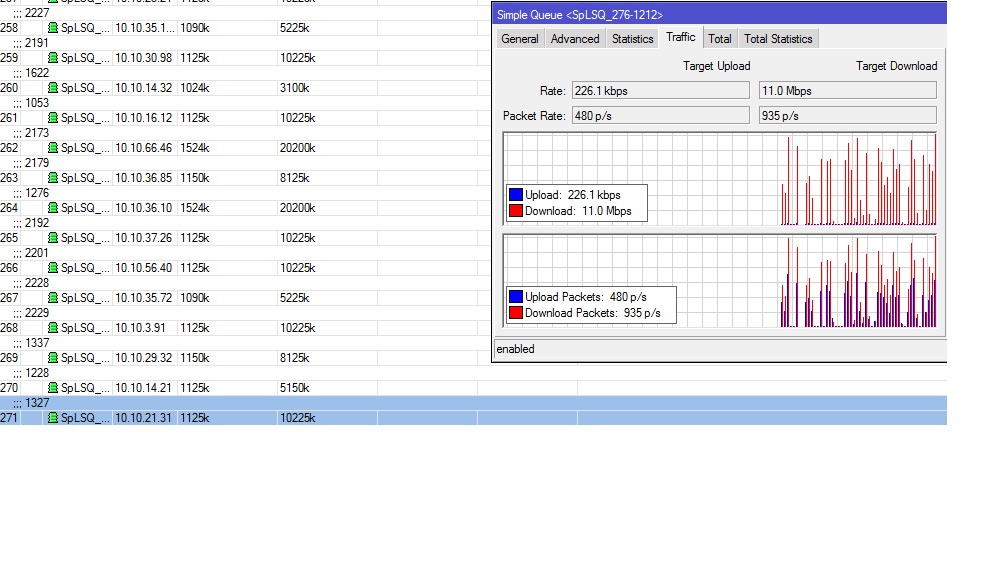
To follow on, I have looked at a client who is using significant data at the moment and I took a simultaneous screen shot of what Splynx says and the actual queue in the Mikrotik router. A few moments later I also took a screen shot of the CPE.
As you can see, the CPE and Queue correlate pretty closely, while SPlynx doesnt!!


Hi, Splynx chart is 5 minute average and it will NEVER be the same as your real chart on Router or CPE !!!
If you choose the “Daily” it will show you even worst data. This is the RTG tool that we use and it’s the behaviour for 5 minutes interval.
I will connect now one live router, run the counters on Simple Queue and will check the Splynx stats
According to my tests API data usage stats are 100% correct.
The issue with Andy’s server was made because of the manual change inside MySQL database. There was a incorrect flag on removed services.
It’s not good to change the data directly in SQL, unfortunately sometimes it must be done (some migration, special requirement etc.). I consider this as a one time issue on particular deployment. We are upgrading Andy’s server with SQL data hotfix
1 Like
Like usual - Alex is on top of stuff. !!!
Yes he got it sorted quickly OK!
Although to be clear, I was correct in that the stats in our Splynx server were incorrect, the issue was due to a change script that Splynx carried out to alter an unrelated issue set the incorrect flag in the DataBase and this caused the Splynx accounting process to crash every 5 minutes, and thus incoorectly record the data.
This has now been rectified so customer stats should now be OK. I will do a correlation in a couple of days