Hello!!
We have a request to be able to visualize in the graph of the client’s statistics, the errors / disconnections that the client may have.
I do not know if we could access the module of the graphs or if you could enable us the visualization of errors, something like this.
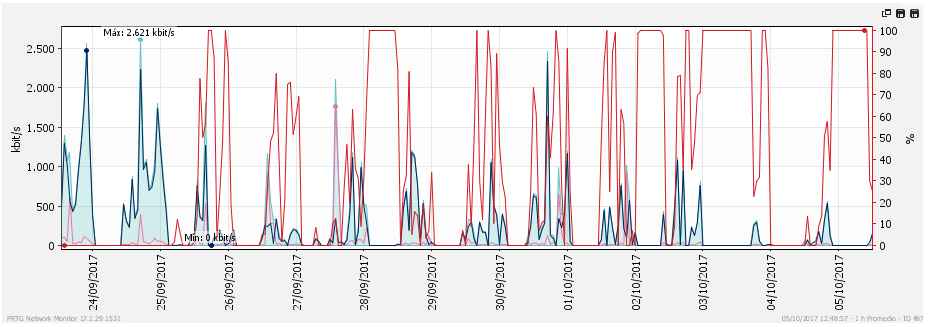
RED = Out of service IP
Here we looked at the possible errors and we could compare between clients.
Regards!