Hi there!
Is it possible to add graphs for data usage and not only throughput graphs? Data usage graphs will make much more sense for a customer in a CAPPED environment. Also, a daily throughput graph will be much better, because switching the current graphing to monthly/weekly, shows almost no practical data, as it will be calculated as an average.
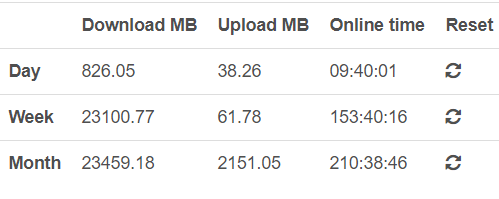
Is there a history of data usage per user per day? Below is a very nice to have, but I cannot find the daily usage in a list… Data usage graphing history will also be excellent!