Hi there!
We discovered what we think is a bug or misinterpretation of data.
We have this on a back-end of a user:
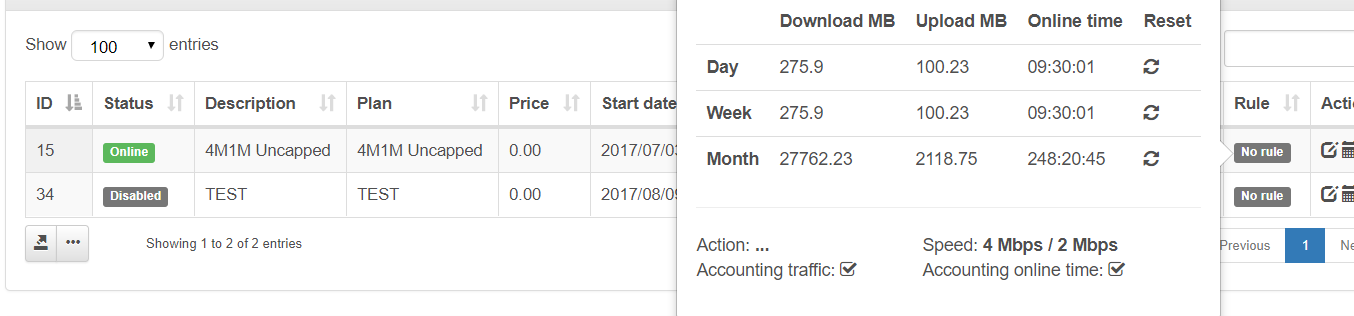
And

Now if you go to the Client Portal, it shows a combination of the services, instead of only the active one…
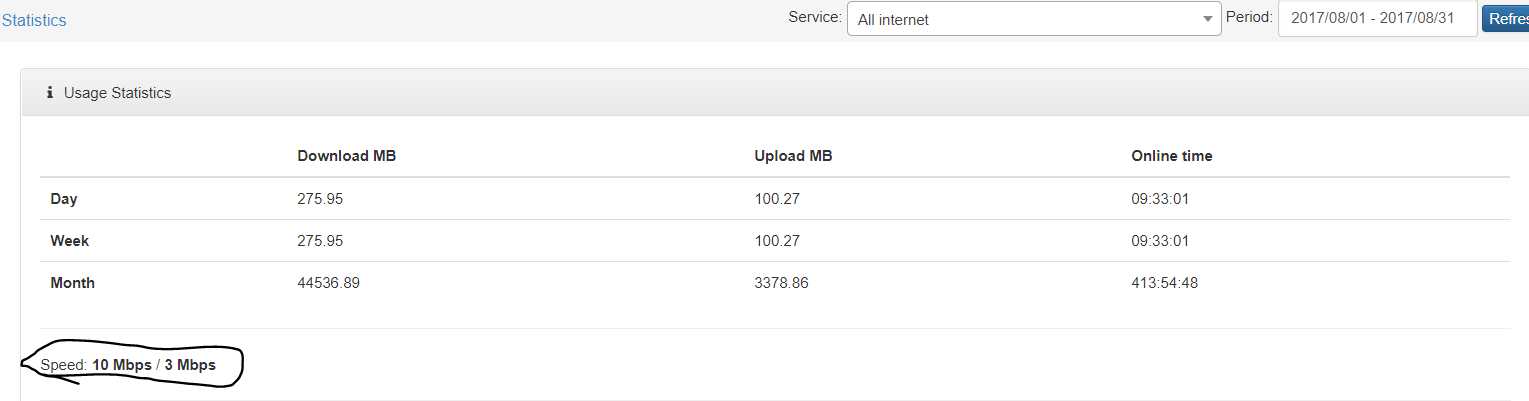
Even when changing the filter here, does not fix the issue:
Even thought the one service is disabled, it still uses the data…
Also on capped services, the Total Bandwidth is put together…
We would like the services to be displayed separately here, as some customers have more than one connection to monitor…
Thank you!